Special Report Review Of The Korean Shipbuilding Industry’s Ideal Production Capacity
페이지 정보
작성자 최고관리자 댓글 0건 조회 2,607회 작성일 19-10-30 14:48본문
Yoo-sang Park, Research Fellow at the Industrial Technology Research Centre, The Korea Development Bank’s Future Strategic Institute
I. Summary
1. Study Background
(1) The Resilience Of The Shipbuilding Industry’s Demand And Rigidity Of Distribution Leads To Great Market Fluctuations
Resilience of the shipbuilding industry’s demand(orders received and transported) and rigidity of distribution (docks, construction facilities, and ship maintenance numbers) causes a market mismatch leading to cyclical industry boom and bust. These timing differences between demand and distribution is identified as one of the main causes affecting the shipbuilding industry’s market fluctuations.
(2) Depending On Market Conditions, Boom’s Lead To Repeated Infrastructure Investments And Bust’s Lead To Repeated Restructuring
Between 2002 - 2007, a global increase in transported goods from a booming market led to large scale infrastructure investments. However, the Global Financial Crisis(GFC) in 2008 led to restructuring. Korea also saw large scale infrastructure investments and the founding of new companies during the market boom, but fell victim, as with the rest of the world, following the GFC.
(3) Semi-permanent Capital Attributes Required In Long-term Investment Decisions
There are legitimate reasons when investing in capital, consequentially they are regarded as unnecessary investments. In 2007, there were warnings with regards to surplus production abilities; however, we believe that there was insufficient review due to excess orders and short-term profit seeking. The non-consideration of semi-permanent capital’s attributes during the decision-making process is regrettable.
2. Purpose Of The Review And Its Limitations
We review the ideal production capacity needed to contribute towards the mitigation of restructuring distress. But, is limited by various factors that could not be predicted and/or reviewed.
(1) Purpose
Considering the characteristics of the industry’s repeated boom and bust cycle, it is necessary to alleviate restructuring distress through prior appropriate investments. Review of appropriate mid-term production capacity should be carried out to alleviate the frequency of booms and busts. Also, the ideal production capacity of large shipbuilders and small-to-medium shipbuilders should be categorized separately to be adopted as references during restructuring.
(2) Limitations
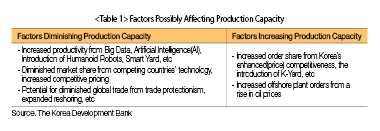
Upon analysis in relation to production equipment(docks), there are various factors which cannot be predicted and/or reviewed. Also, there is a high possibility of irrational investments being made during market booms. On the basis of outlook and assumptions, a mismatch is inevitable and needs to be managed continuously into the long-term.
The study is limited to physical capital upon excluding factors which cannot be accurately measured such as production and labour efficiency.
- Non-consideration of the defence industry supply(current ideal production capacity, as well as future orders, are excluded to not affect estimations)
- Existence of factors affecting production capacity which cannot be assumed nor predicted
- Despite suggestions of an ideal production capacity from past experiences, it is highly likely that pressure from local communities, the media as well as attempts to maintain market leadership will inevitably lead to irrational investments once the market begins to boom again
- As the shipbuilding industry is a unified global market, it is also beneficial to examine the global production capacity
II. Review of Current Production Capabilities
1. Current Status Of Domestic Shipbuilders’ Production Capacity(Docks)
Domestically, including unoccupied docks and also excluding small manufacturers, there are 36 docks.
(1) Docks
Including unoccupied docks and excluding disposed of (sold) floating docks, Korea has 36 docks.
- (Large companies) Between the four following companies: Hyundai Heavy Industries, Hyundai Samho Heavy Industries, Daewoo Shipbuilding & Marine Engineering, and Samsung Heavy Industries there are eighteen dry docks and nine floating docks.
- (Small-to-medium companies) Between the five following small-to-medium companies: Hyundai Mipo, Korea Shipbuilding Corporation, Dae Sun Shipbuilding & Engineering, STX Offshore & Shipbuilding, and Sung dong Shipbuilding & Marine Engineering there are seven dry docks and two floating docks.
(2) Production Capability And Adjustment History
A slump in the shipbuilding industry caused it to undergo structural changes to its production capacity by closing dry docks and disposing of floating docks. Domestic floating docks are usually sold-on to companies in the same industry, primarily for managing shipbuilding equipment and ship maintenance. However, once the industry economy begins to revive, the docks are likely to be used for building new ships.(Potential for production capacity expansion).
2. Review Of Current Production Capabilities
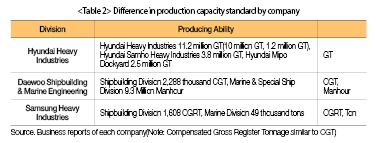
Various definitions and notations for production capacity exists, and companies set maximum output performance and compensated gross tonnage (CGT) as standards for production capacity.
(1) Production Capacity
Maximum output usually refers to situations when production equipment is, under normal conditions, operating at maximum capacity(i.e. production efficiency and factory operation is at 100%). This report assumes a company’s maximum production performance is as defined by Clarksons(World Shipyard Monitor) and the Korea Shipbuilding & Marine Plant Association (CHO).
(2) Recording Methods
Various recording methods such as CGT, Gross Tonnage (GT), man-hours, etc., are used by companies. This report adopts CGT, a standard most commonly used by shipbuilders.
(3) Domestic Shipbuilders’ Production Capacity
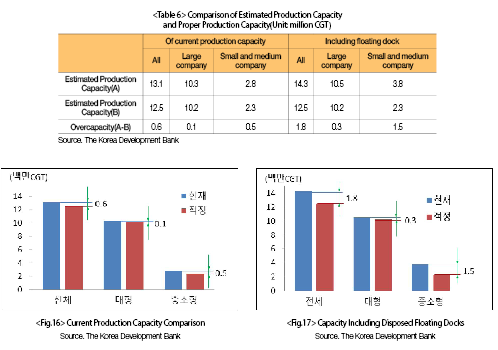
It is estimated that domestic shipbuilders have a production capacity of 13.1 million CGT(if including disposed floating docks, then production capacity is 14.3 million CGT). It is estimated that large domestic companies account for 10.3 million CGT and small-to-medium companies account for 2.8 million CGT(if include disposed floating docks, then large companies account for 10.5 million CGT and small-to-medium companies account for 3.8 million CGT).
Disposed of floating docks are included in estimations as it is highly likely that they will be used again for new constructions during market booms.
Economic growth period estimations include currently unused equipment with the potential to be used during growth and exclude small enterprises production capabilities and the defence industry’s capacity.
III. Ideal Production Capacity Calculations
1. Definition Of Ideal Production Capacity
Ideal Production Capacity is the ability to construct a new ship within 1.69 years, the average construction period for each type of ship. In general, the order-made production industry such as the shipbuilding industry and construction industry judges appropriate work level as the number of days spent on construction. This report will use 1.69 years, the industry average, as the Ideal Production Capacity standard.
Upon weighting the order average by ship type, it takes 1.69 years from order to delivery; however, the industry usually uses 2 years-worth of work. Also, increased productivity has helped reduce the construction period when compared to the past, now the 1.69 years is inclusive of the design period when the yard is not yet in operation.
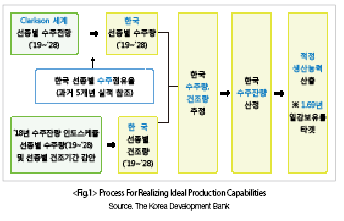
2. Means For Realizing Ideal Production Capacity
Clarksons has calculated orders by applying Korea’s long-term(10 years) order forecast by shipbuilding periods and by ship type. They have categorized large vessels and small-to-medium vessels, and have assumed that large companies construct large ships only and small-to-medium companies only construct small-to-medium ships.(Hyundai Mipo is categorized as a medium-to-small company)
Large and small-to-medium shipbuilders are each calculated to have a 10-year production capacity average of 1.69 years per ship.
- (Large) LNG carriers·upward Suezmax-class(125,000 DWT) tanker·Capesize(100,000 DWT)bulk carrier·container ships in excess of 3,000 TEU·marine plants, etc
- (Medium-to-small) Container ship under 3,000 TEU·under Aframax-class(85,000 – 125,000 DWT) tanker·under Panamax-class(65,000 – 100,000 DWT) bulk carrier
It is assumed that Korea’s annual share of order obtention is unchanged. Increased productivity, competing countries’ technological development·change in price competitiveness, etc is difficult to predict, so it is not considered.
Productivity increasing factors such as the introduction of Smart Yard using block enlargement, improved first-mover rate, and Big Data·Artificial Intelligence are not considered. The competitiveness of competing countries is also not considered; however, it is expected that China and Japan’s competitiveness will remain unchanged from current levels. It is assumed that from China’s poor on-site planning abilities, weak labour productivity, and inefficient maintenance systems, technological development· increased productivity will be stagnant. Japan is also expected to maintain current levels of market share arising from its ageing labour force, the shipbuilding industry’s diminished importance, and weak infrastructure investments.
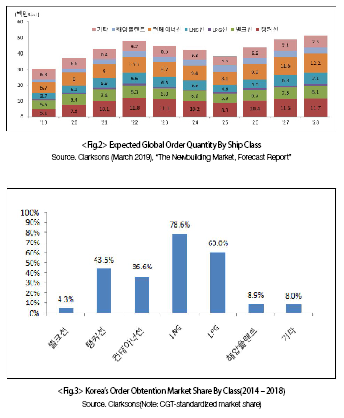
3. Estimated Ideal Production Capacity
This report incorporates information from Clarksons’ Order Quantity Forecast Report for March 2019. From 2018 - 2019, the expected global order quantity is 42.7 million CGT per annum, an increase of 22% compared from 2009 - 2018 which saw an average order quantity of 35 million CGT.
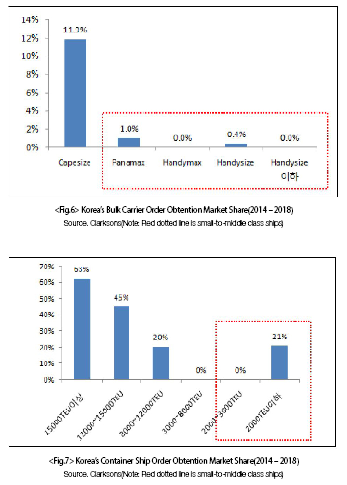
Upon applying Korea’s order obtention market share, estimated order obtention, number of ships built based on building period and by class, the residual order obtention is calculated. Korea’s order obtention rate for the next ten years is calculated from performance over the past five years(2014 - 2018), based on ship class and size. Korea’s order obtention market share by class over the past five years is as follows: LNG ship’s 79%, LPG ship’s 60%, Tanker’s 43%, and Container ship’s 37%.
- (Tanker) VLCC 62%, Aframax 64%, small 12%, and others 30 – 40%
- (Bulk Carriers) Capesize 12% and others less than 1%
- (Container ships) Greater than 15,000 TEU 63%, 12 to 15,000 TEU 45%, and other 20%
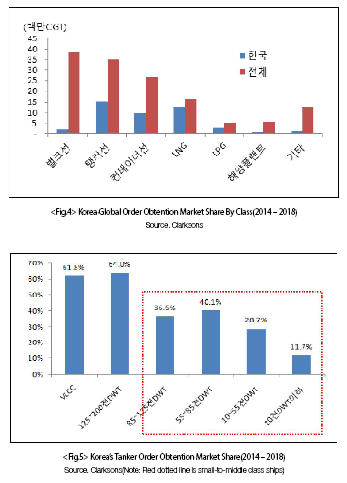
(1) Korea’s Order Obtention Market Share By Class For The Next 10 Years
Korea’s order obtention market share by class for the next 10 years is as follows: order obtention market share of vessels with high order quantity or various vessel sizes such as tankers, bulk carriers, and container ships, considering Korea’s performance and competitiveness, is assumed to be as depicted in < Figure 8 >.
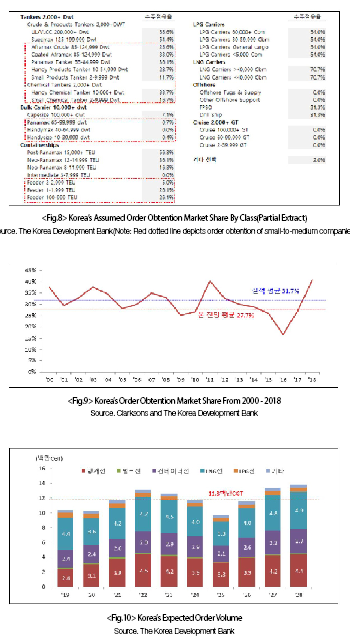
It is assumed that order obtention, by class and size, is the same every year. Over the next 10 years, order obtention market share will increase an average of 27.7%. From 2000 - 2018, Korea’s order obtention market share was on average 31.7% but has been showing a downward trend → past 15 years: 30.3% → past 10 years: 29.4% → past 5 years: 27.9%.
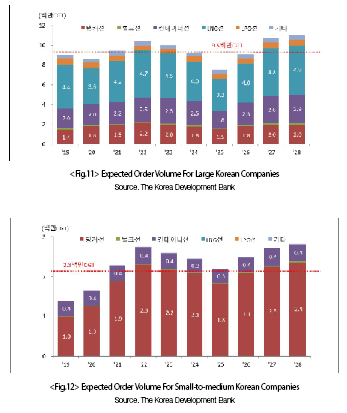
Korea’s order obtention for the next ten years(2019 – 2028) is the same as that of Clarksons’ expectation, x, depicting order obtention market share. Clarksons calculated Korea’s order volume by applying its order share, by class and size, to its order obtention expectations. From 2019 – 2028, Korea’s average order volume will be 11.8 million CGT – 9.5 million for large companies and 2.3 million for small-to-medium companies. The expected order volume by class is depicted in < Figure 10–12>.
(2) Expected Annual Rate Of Construction And Rate Of Backlog
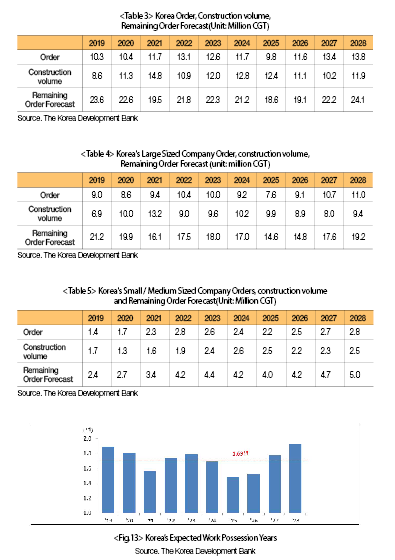
The expected annual rate of construction and the rate of backlog is as follows: the average construction period by ship class was considered when calculating construction volume(it is assumed that design and construction take place within the average construction period immediately following order placement; however, in reality, construction proceeds based on an agreed-upon schedule with the ship’s owner). Final order obtention is calculated as follows: beginning order backlog + orders received – construction volume. Orders received, construction volume, and order backlog is depicted in <Tables 3–5>.
(3) Korea’s Ideal Production Capacity Is 12.5 Million CGT (Large Companies 10.2 CGT And Small-to-medium Companies 2.3 Million CGT)
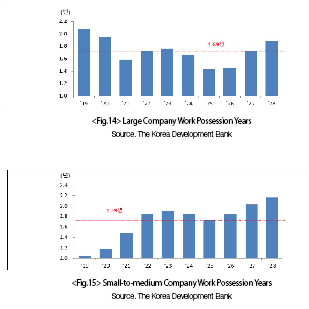
Based on annual orders received, construction volume, and order backlog, an estimated 12.5 million CGT is expected from the average number of working years, as per the average construction period of 1.69 years.(Production capacity of 12.5 million CGT = large companies 10.2 CGT + small-to-medium companies 2.3 million CGT).
Korea’s annual work possession years for all small-to-medium and large companies are depicted in <Figures 13–15>.
4. Ideal Production Capacity Study Results
Korea’s current estimated production capability is 13.1 million CGT, exceeding its ideal production capacity of 12.5 million CGT by 0.6 million GCT(if include disposed floating docks, estimated production capacity will be 14.3 million CGT, an excess of 1.8 million CGT).
IV. Conclusion
1. Current Production Capacity(13.1 Million CGT) Narrowly Exceeds Ideal Production Capacity(12.5 Million CGT) By 0.6 Million CGT.
If floating docks disposed of by domestic firms are excluded, current capacity closely resembles ideal capacity. It can be judged that production facility restructuring has been considerably successful.
However, considering the omission of data from several categories as well as forecast error in Clarksons’ aggregate data, extra production capacity is needed to allow for production growth. Clarksons’ data only aggregates CGT for FPSO and drill ship-type vessels, whilst excluding upper structures and dispersion supply from aggregate figures. Furthermore, unexpected market booms and fluctuations in oil prices need to be accounted for in production capacity considering the characteristics of large ships such as off-shore plants.
2. Avoiding Quantitative Investment And Focusing On Quality Improvement For The Next 10 Years
Current production capacity only narrowly exceeds ideal production capacity. However, the need to expand production capacity, including the construction of new docks, is expected to be low over the next 10 years.
(1) (Large companies) Production capacity is at an ideal level. Productivity and quality reform for Smart Yard R&D is continuously needed.
- In the long-term, overseas block plants will withdraw considering the domestic production capacity. In the future, companies will refrain from establishing new plants overseas; Instead, they are likely to import manpower, if needed
- Continuously seek-out ‘Smart Yard-ization’ for productivity reform
(2) (Small-to-medium companies) Excluding disposed of floating docks within Korea, production only narrowly exceeds ideal capacity. Current levels of operation by medium-sized shipbuilders need to be maintained
(3) (Other) Caution should be given to the conversion of block companies to new ship builders, which can led to the establishment of overseas block plants for large shipyards
3. If an unexpected big cycle occurs, ideal production capacity will need to be re-examined, with the prioritization of repurchasing disposed of floating docks within Korea
Order quantity, at that point in time, must be considered when re-examining ideal production capacity. If production capacity needs to be expanded, the repurchase of domestically disposed of floating docks should be prioritized. Korea built more than 15 million CGT-worth from 2008 - 2011, if and when disposed of floating docks are repurchased, production-levels will reach 14.3 million CGT, almost at par with previous levels. However, this is highly unlikely. Even if booming orders like those of the early-2000s is reproduced, it is expected that the need for overseas-entry and investments into new dry docks will be low.

